Semi-Supervised Graph Imbalanced Regression
Introduction
From molecules to social networks, graphs are ubiquitous in our daily lives, playing crucial roles in various applications. For example, users in a social network can be represented by their ego-nets, molecules can be represented by graphs of atoms and bonds, sentences can be represented by their semantic graphs, etc. To better learn from graph data, graph neural networks (GNNs) have been developed and are commonly used for graph property prediction tasks, such as graph classification, in which we seek to map individual graphs to one or more labels. Nonetheless, there has been less focus on the area of graph regression with GNNs, which aims to directly predict numerical properties of the given graph such as a user’s age, a molecule’s melting point, etc.
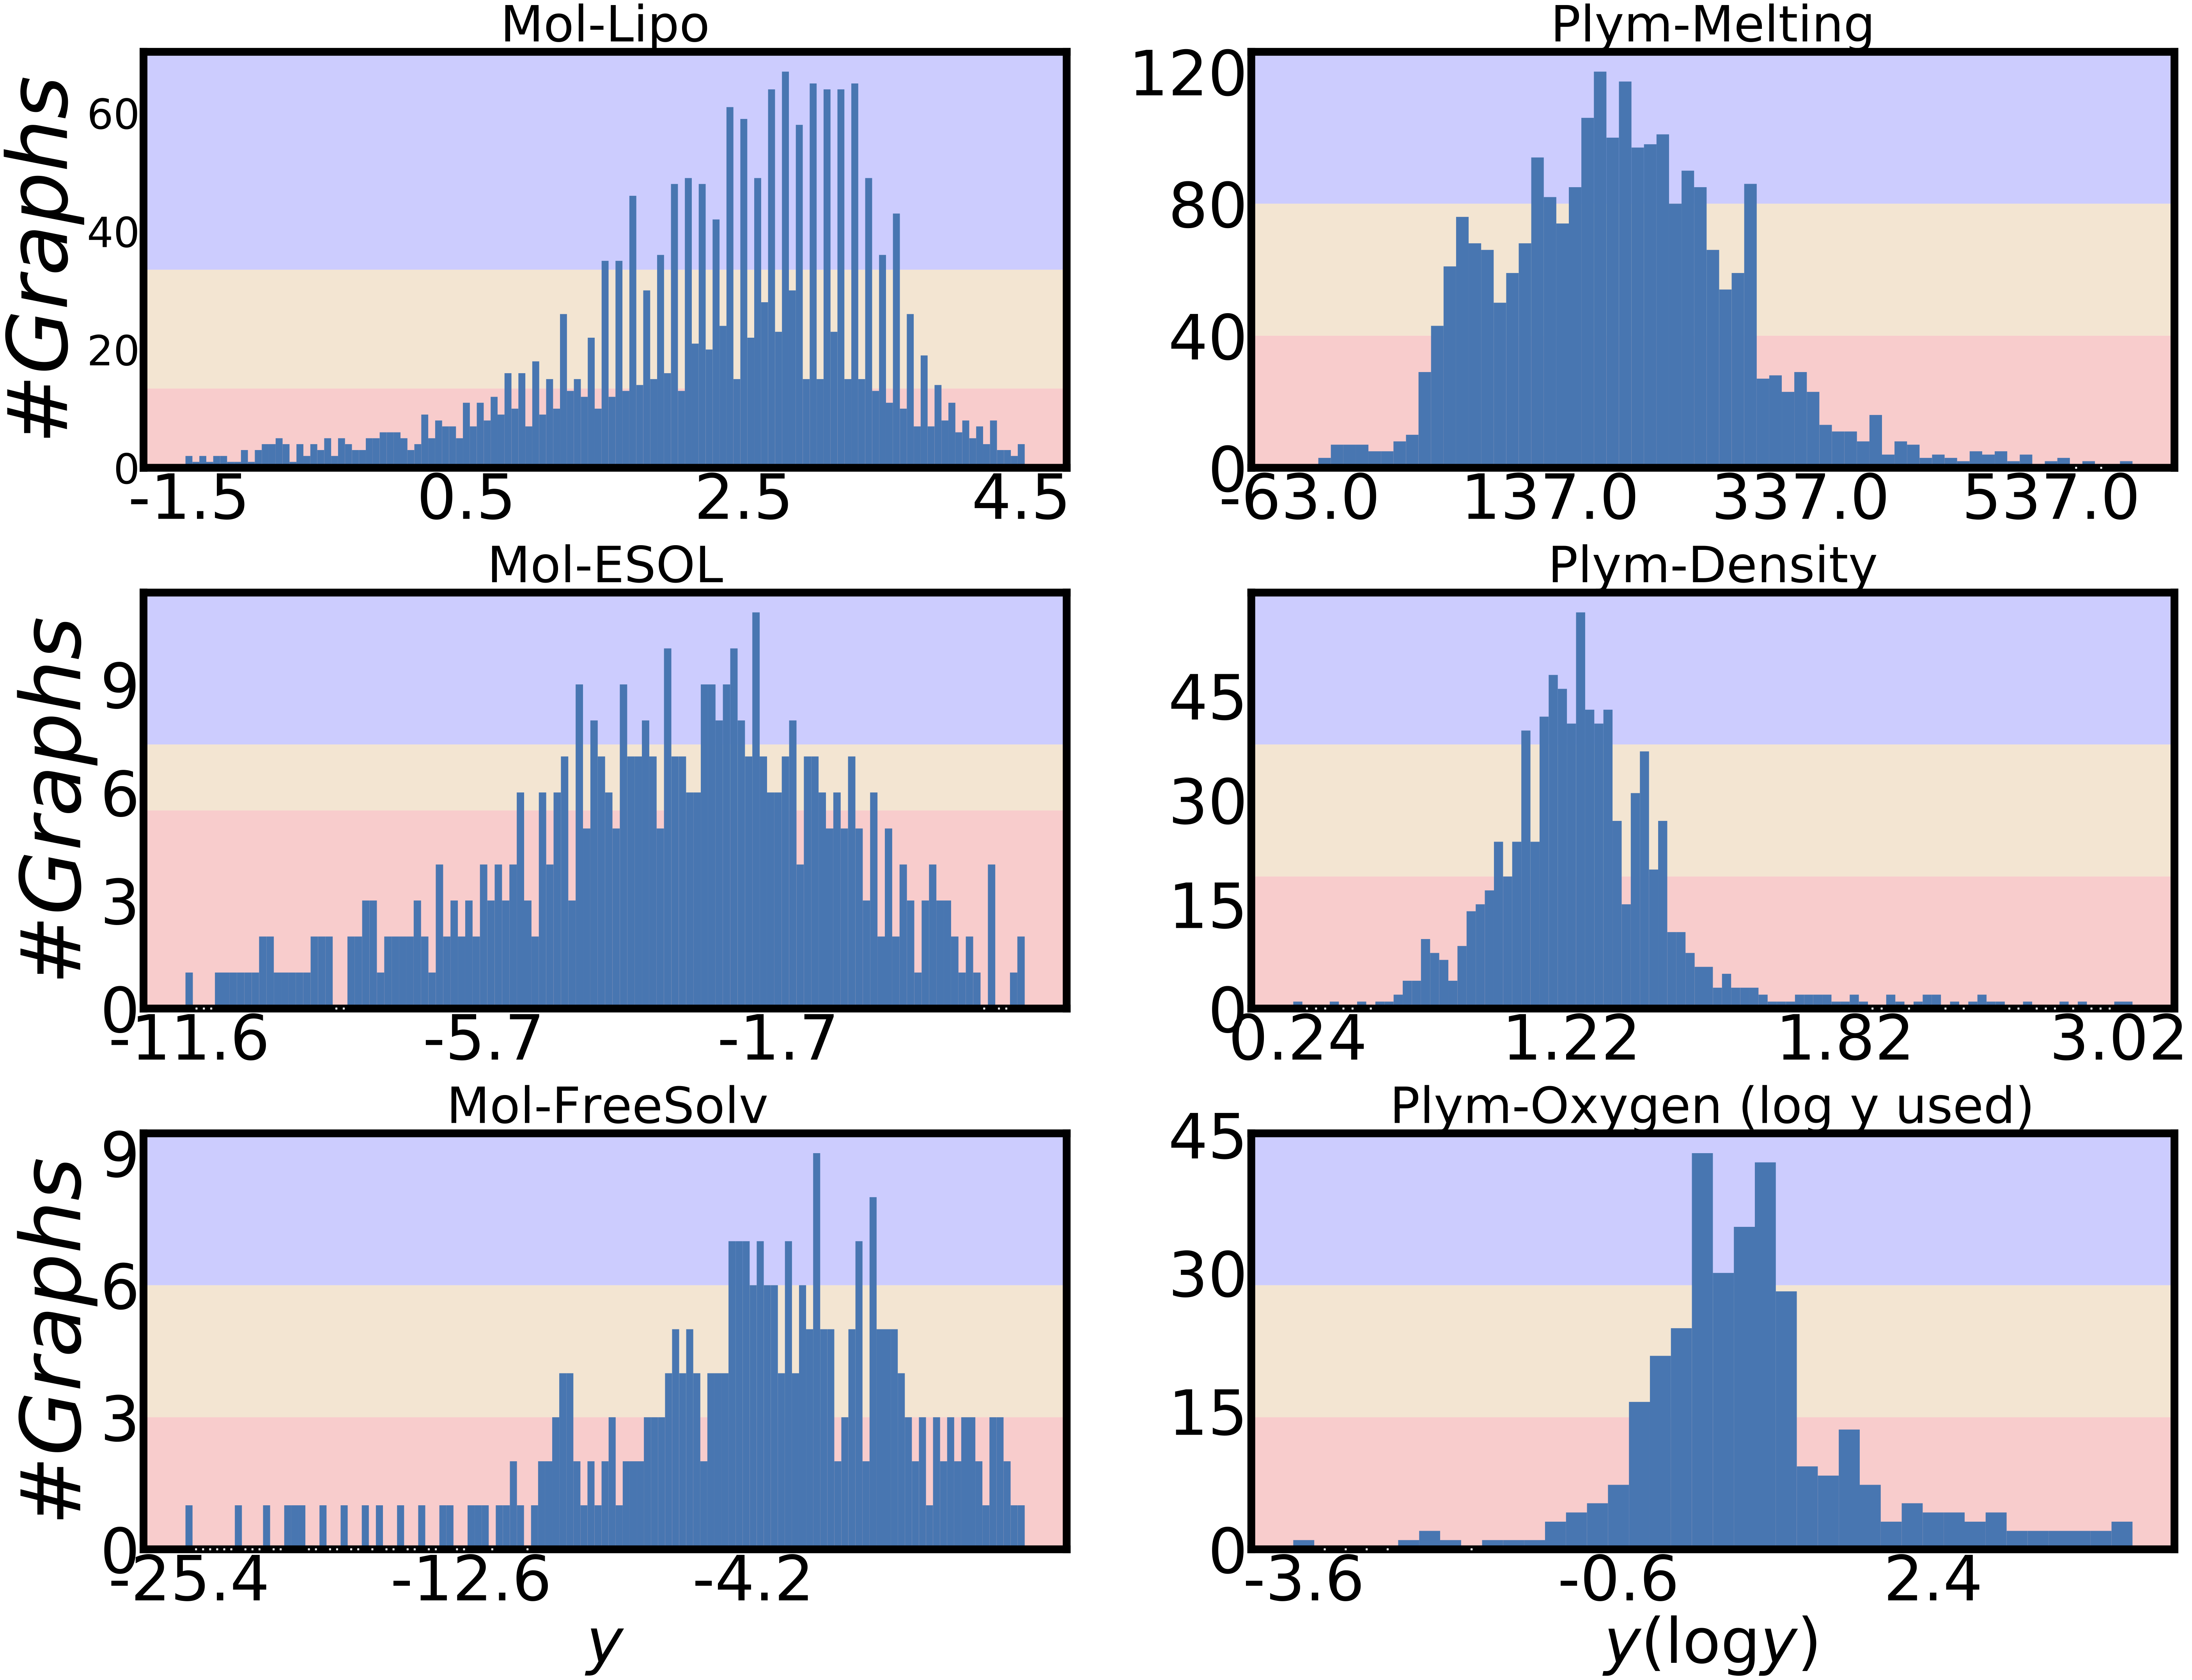
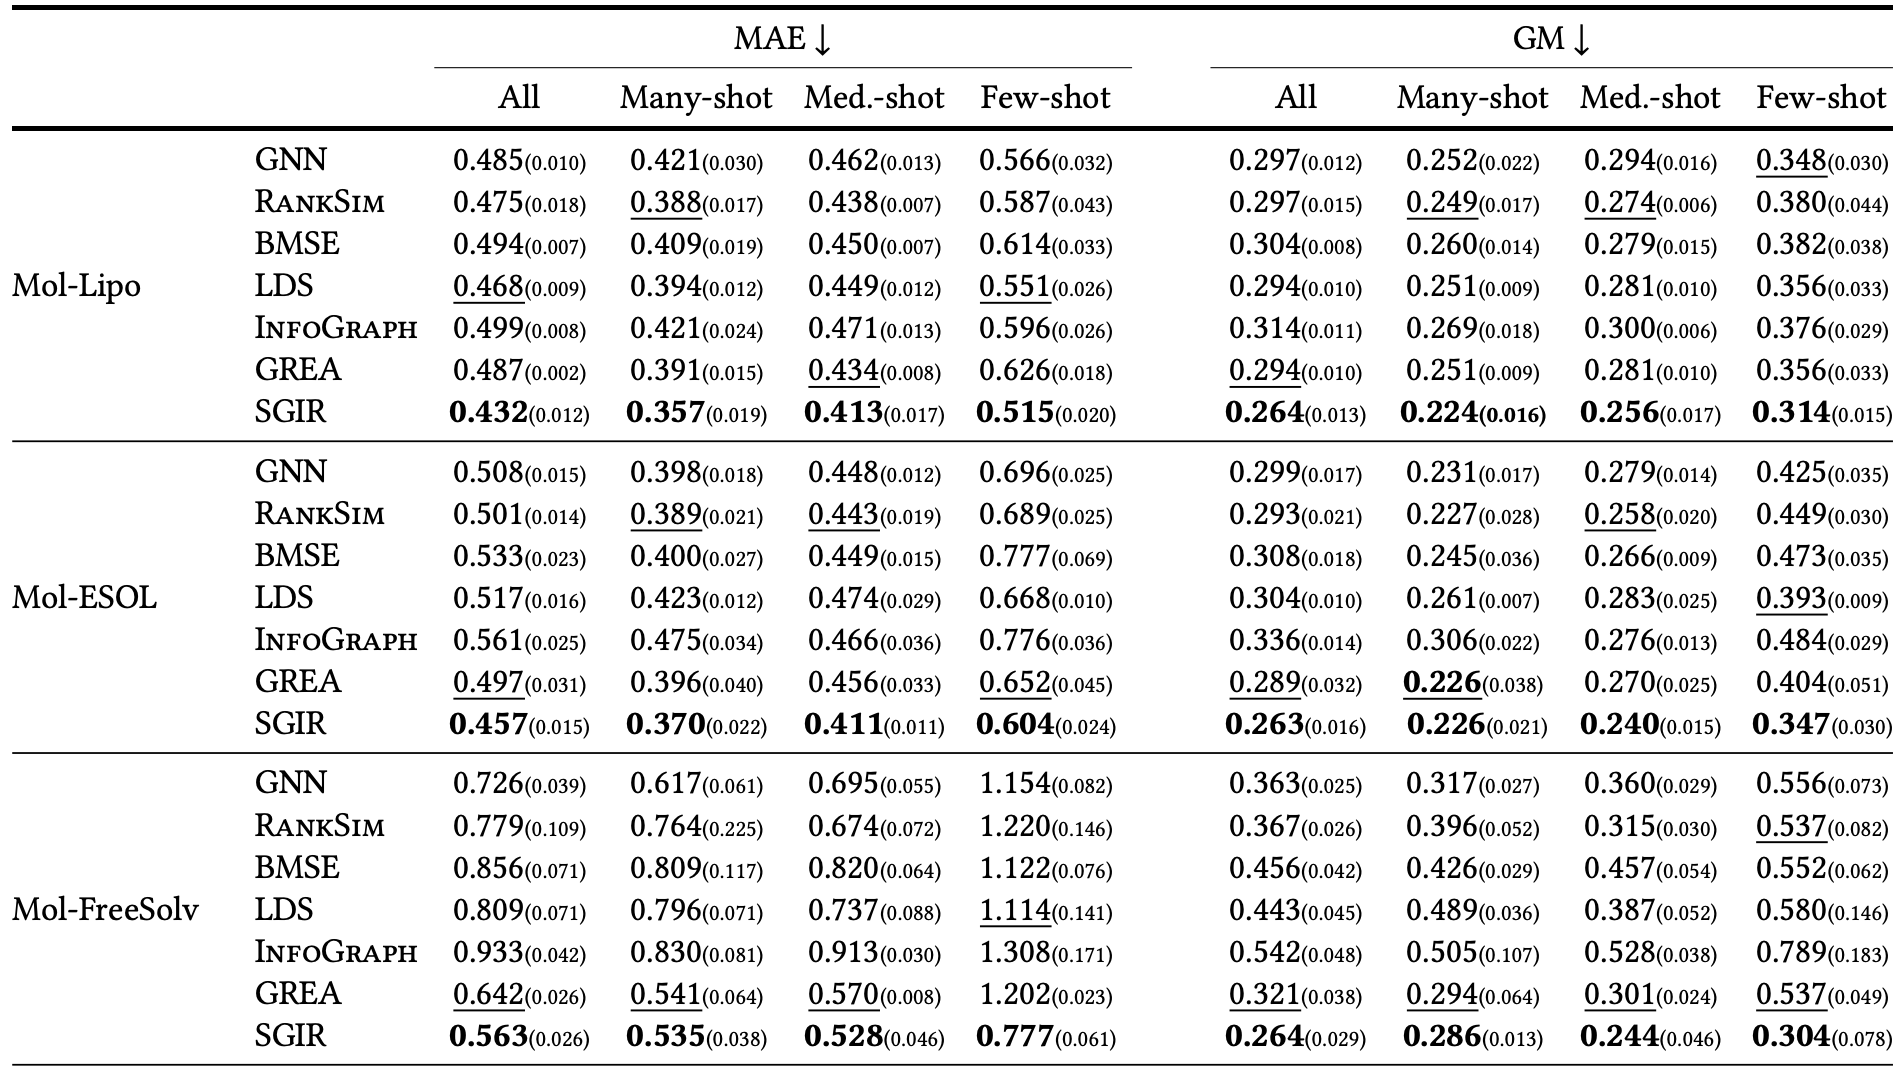
In our recent paper Semi-Supervised Graph Imbalanced Regression, to be presented at KDD 2023, we focus on the task of graph regression, and identified two major challenges in effectively handling this task: (i) due to the high cost of human annotation, the amount of labeled training data is usually very limited; (ii) the annotated data usually concentrates on small, yet popular areas in the property spaces, making the distribution of the graph labels often severely imbalanced (as illustrated in Figure 1). When trained with heavily imbalanced data, machine learning models usually cannot make good predictions on minority labels as the training process is biased towards the data with majority labels. In this work, we propose a novel semi-supervised learning framework, named SGIR, for such imbalanced graph regression tasks. SGIR is a semi-supervised learning framework that balances the label distribution in the training data by generating additional labeled data from the unlabeled data. Our work provides both theoretical motivation and empirical analysis for SGIR across seven diverse graph regression tasks. For example, on the FreeSolv dataset with only 276 labeled training graphs, SGIR achieved 30% Mean Absolute Error (MAE) improvements in the under-represented label range and 12% MAE improvement overall compared to state-of-the-art graph regression methods.
SGIR Framework for Imbalanced Graph Regression
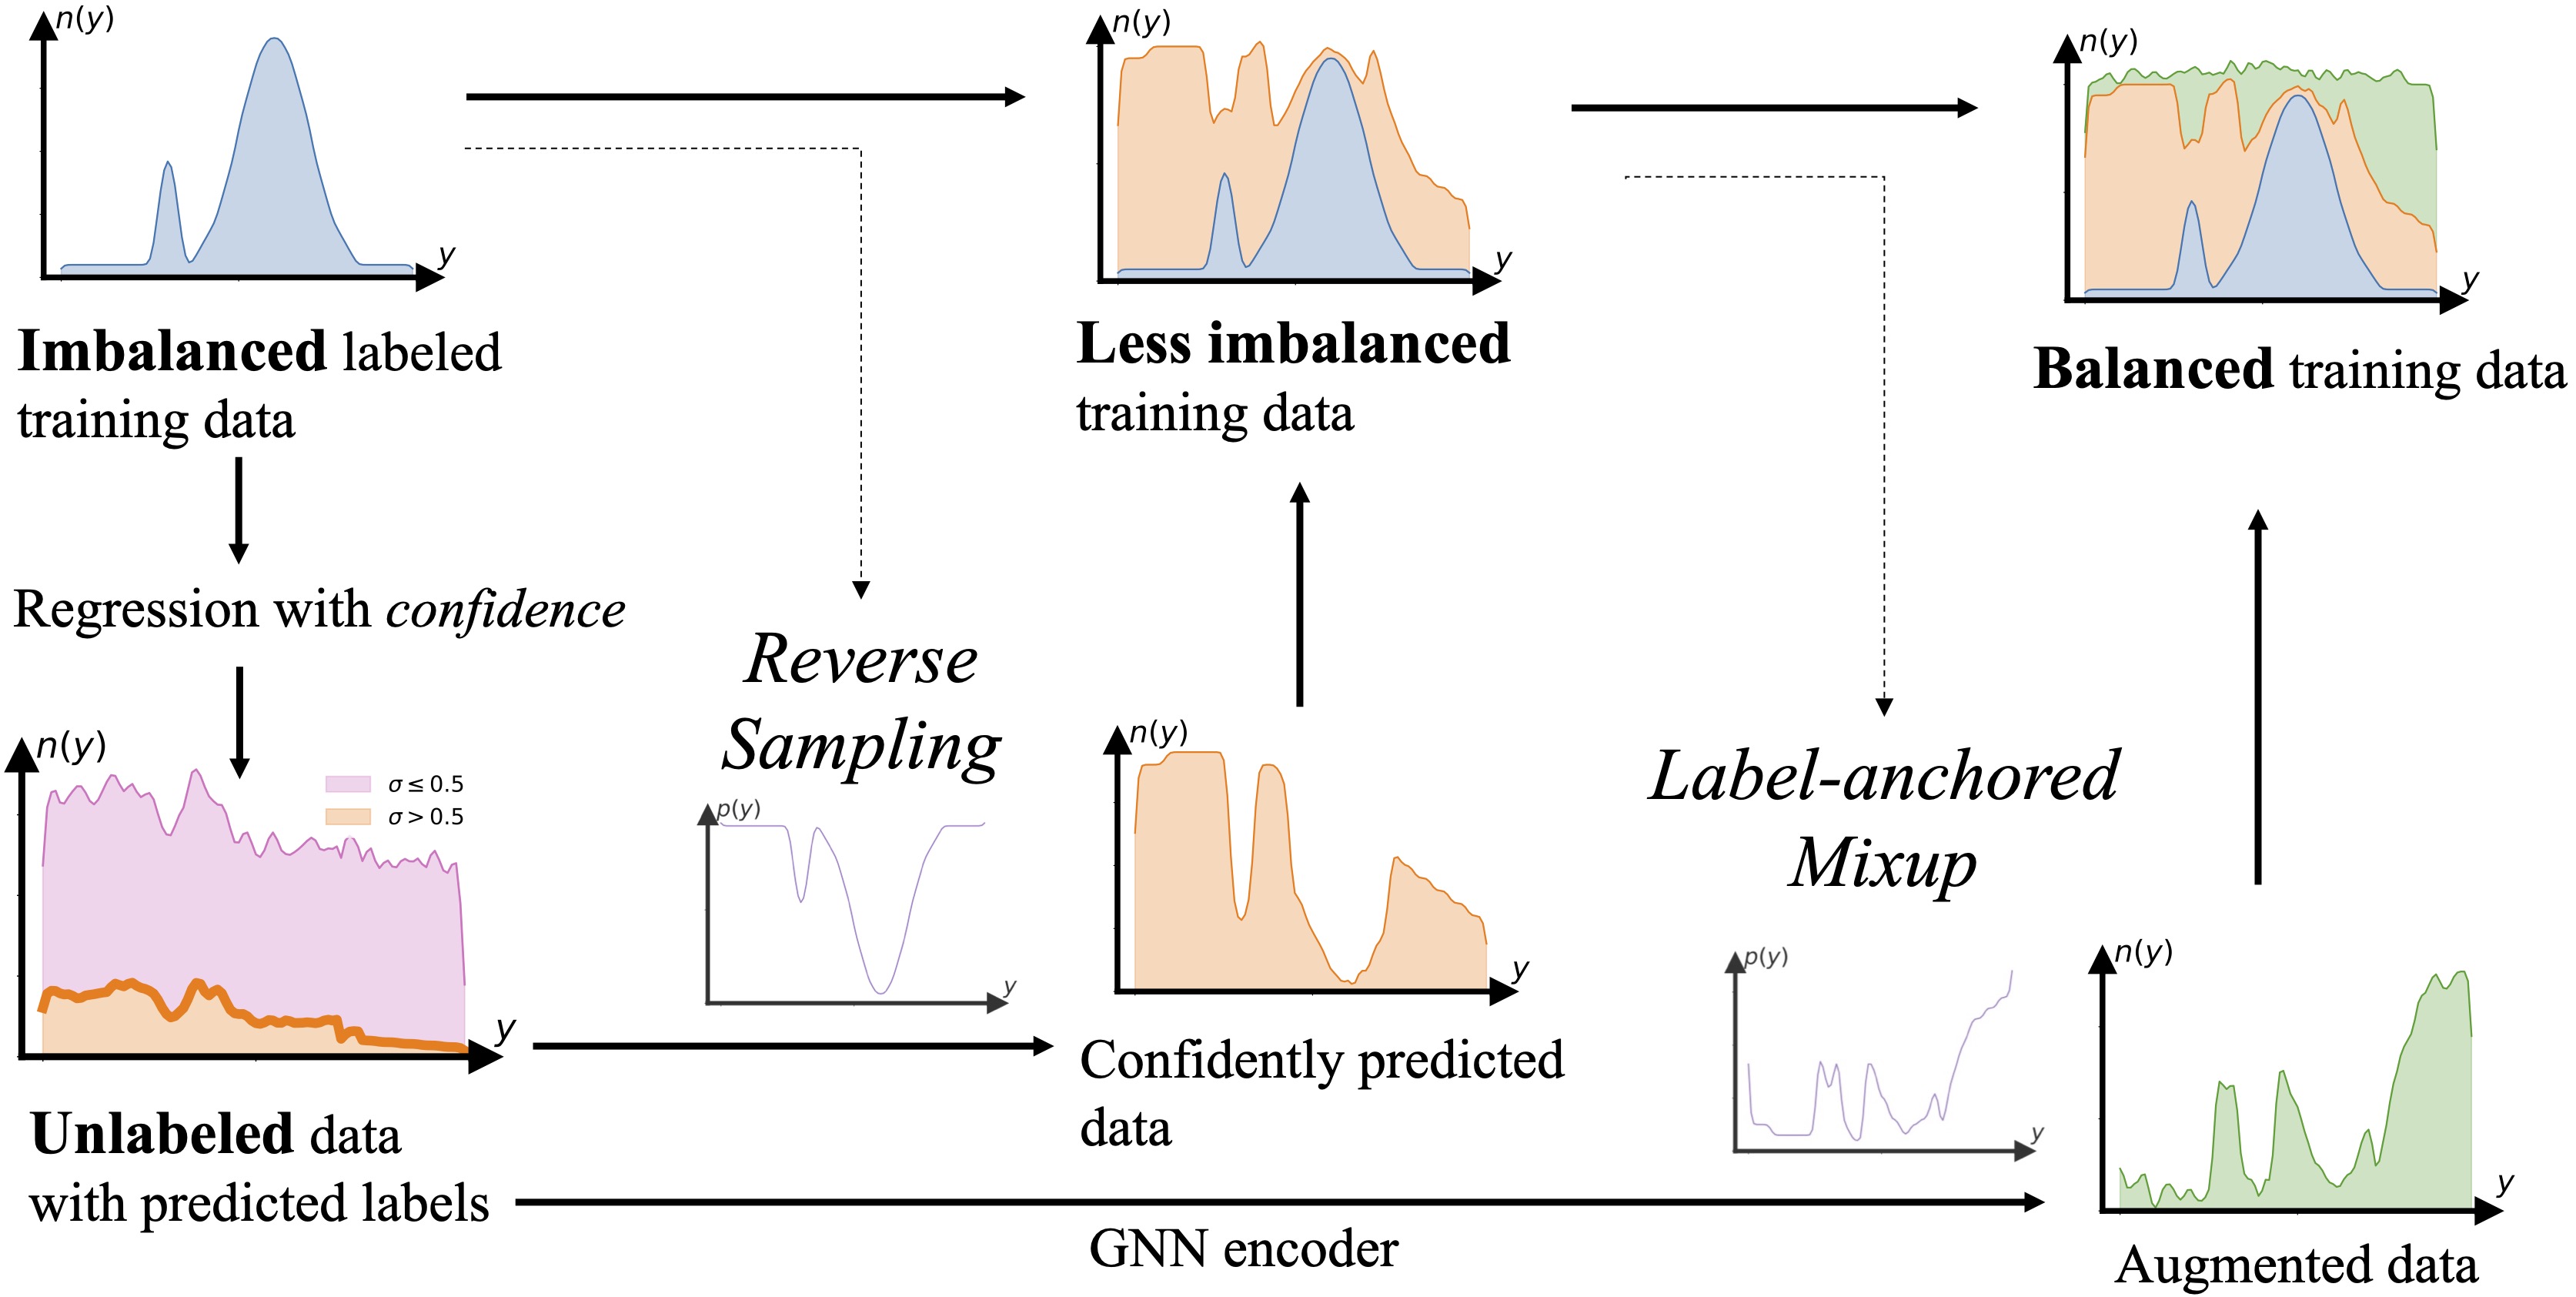
SGIR is built based on self-training, which is a training scheme to increase the labeled training set by adding pseudo labels for unlabeled data. Specifically, it involves first training a model that iteratively assigns pseudo-labels to the set of unlabeled training examples with higher confidences, and uses these confidences to place them into the labeled training set in the subsequent iteration. Figure 2 presents the high-level design of SGIR, which enriches the labeled training set by two steps: generating pseudo-labels for unlabeled data and then data augmentation. We hypothesize that with the balanced training set generated by SGIR, the GNN model can be trained with less bias towards the label majority and reach an overall better prediction.
Graph Regression with Confidence
Unlike classification models which give label predictions in addition to confidence scores (normalized logit values after softmax), regression models only output their predictions, which poses a big challenge for using self-training on regression tasks. In this work, we take advantage of graph rationalization to get the confidences for the graph regression model’s predictions. Specifically, the graph rationalization model separates each given graph into two parts when making the prediction: a “rationale” subgraph that correlates with the task label, and the ambient “environment” subgraph which is inferred to be unrelated to the label. With the rationale and environment subgraphs, we measure the confidence of graph property prediction based on the reliability of the identified rationale subgraphs. Specifically, we use the variance of model predictions from the combination of one rationale subgraph with multiple different environment subgraphs as the indicator of the prediction confidence. Low variance indicates that the model can make consistent predictions for the same rationale subgraph with different environment subgraphs, signifying that the rationalization step successfully identified a high-quality rationale subgraph. Consequently, these predictions are more likely to be accurate compared to those with high variance (i.e., low-quality rationale subgraph).
Reverse Sampling
With the confidences from the rationalization as described above, we pick the unlabeled data with high confidence predictions to enrich the labeled training data, with the predictions being their pseudo-labels. We use reverse sampling to selectively add unlabeled examples that are predicted to be in the under-represented label ranges. That is, we first invert the imbalanced data distribution and then use it to sample from the high confidence predictions (dashed arrow in the left half of Figure 2). As shown in the lower-left plot and the middle column of Figure 2, we reverse the imbalanced training label distribution, use it to sample from the high confidence predictions, and add those examples with their pseudo-labels back to the training data.
Label-anchored Mixup
In practical applications, we noticed that even with the reverse sampling described above, the label imbalance issue usually still cannot be fully resolved, as illustrated in the upper-middle plot in Figure 2. The reasons are twofold: (i) the unlabeled data is similarly imbalanced as the labeled training data, such that we may not have enough high-confidence pseudo-labels for the under-represented label ranges; (ii) the original model trained with imbalanced data is more likely to be biased towards the majority label ranges, such that it struggles to give high confidence predictions on the under-represented label ranges due to inherent bias in the raw data. Both of these reasons would lead to insufficient samples with high confidence predictions in the under-represented label ranges. Therefore, we utilize a label-anchored Mixup algorithm to further balance the training data via augmentation. Mixup is a common data augmentation technique to generate new labeled training examples by interpolating pairs of existing ones. With our label-anchored Mixup, we target the under-represented label ranges and compensate for the label imbalance, as illustrated in the right-most column in Figure 2.
Results
We evaluated our approach on public benchmark datasets, which are mainly from the molecular and image domains. Figure 3 shows the molecular property prediction performance on three benchmarks in terms of mean absolute error (MAE) and geometric mean (GM) in different label regions, where many-shot, med.-shot, and few-shot indicate the purple, yellow, and red regions in Figure 1, respectively. Compared with other imbalanced regression and semi-supervised graph learning baselines, our proposed SGIR consistently achieves best performances across datasets as it's able to enrich and balance the training data with confidently predicted pseudo-labels and augmentation. Additionally, the improvements from SGIR in the under-represented label ranges are achieved without sacrificing the performance in the well-represented label ranges.
Conclusion
Our work explored graph imbalanced regression tasks and improved semi-supervised learning for this area. We introduced a self-training framework SGIR that gradually reduced model bias caused by data imbalance through reverse sampling and augmentation. Extensive experiments demonstrated the effectiveness of SGIR on improving the performance on under-represented label ranges without sacrificing that of the well-represented label ranges. Please refer to our paper for more details.