Accelerating Graph Self-Supervised Learning with Clustering
co-authored with William Shiao, Uday Singh, Tong Zhao, Yozen Liu and Vagelis Papalexakis
Graph representation learning is a powerful tool with applications in a broad array of fields, including social network analysis, molecular structure characterization, recommender systems, and more. There has recently been a focus on graph self-supervised learning (SSL), which enables learning node representations without labels which are often difficult to obtain in real-world scenarios. However, most of these suffer from one or more key limitations, including expensive negative sampling steps, complex architectures, and/or dataset-specific augmentations.
In our recent work, titled “CARL-G: Clustering-Accelerated Representation Learning on Graphs,” we propose a novel graph representation learning method, CARL-G, that circumvents many of the above problems. This paper will appear at KDD ‘23, a top conference in data mining. Our results demonstrate that, when matched with the optimal clustering method and clustering-based loss function, CARL-G consistently outperforms alternatives. Specifically, it surpasses downstream node classification standards in 4/5 benchmark datasets while accelerating training by up to 79 times compared to the top-performing baseline. It is also on par with baselines in node clustering and similarity search tasks but is a whopping 1,500 times quicker in training than the top-performing (and slowest) baseline.
Cluster Validation Indices
The core idea behind CARL-G is that contrastive learning (a recent advance in representation learning that has revolutionized how we learn representations without labels) often performs a similar task to clustering. Contrastive learning and clustering both pull positive samples closer together and push negative samples apart. However, contrastive learning has only become popular relatively recently, while clustering has had a long history, which has led to many developments, creating rich opportunities for transfer between the lines of work.
One example of this is the well-studied class of Clustering Validation Indices (CVIs), which are unsupervised estimators of cluster quality. These typically compare a ratio of intra-cluster to inter- cluster distance with the intuition that samples within the same cluster should be closer together, and those in different clusters should be further apart. A popular example of a CVI is the Silhouette score.
Learning Representations with CVI-Inspired Loss Functions
Our paper explores the novel idea of using a CVI as a loss function to optimize a neural network directly (in our case, a graph neural network, or GNN). A CVI requires two inputs: a set of samples and cluster assignments for each sample. In our case, the samples are node embeddings generated via a GNN encoder. Next, we can run a clustering algorithm (we find k-means works best) on the points to obtain a cluster embedding. We can then directly use a CVI as the loss function and backpropagate to update our GNN weights. We describe our architecture in more detail in the next section.
We also show theoretical connections between a silhouette-based loss function and the commonly- used contrastive margin loss function. We prove that the silhouette-based loss is equivalent to the margin loss in both of their optimal cases (see paper for details). We also show that both are sensitive to different parameters - the effectiveness of silhouette-based losses depends on clustering error rate, while margin loss is sensitive to graph structure. This is notable, since adopting a different clustering algorithm to improve results on a given dataset is usually achievable, but changing the graph's structure is typically infeasible.
Architecture
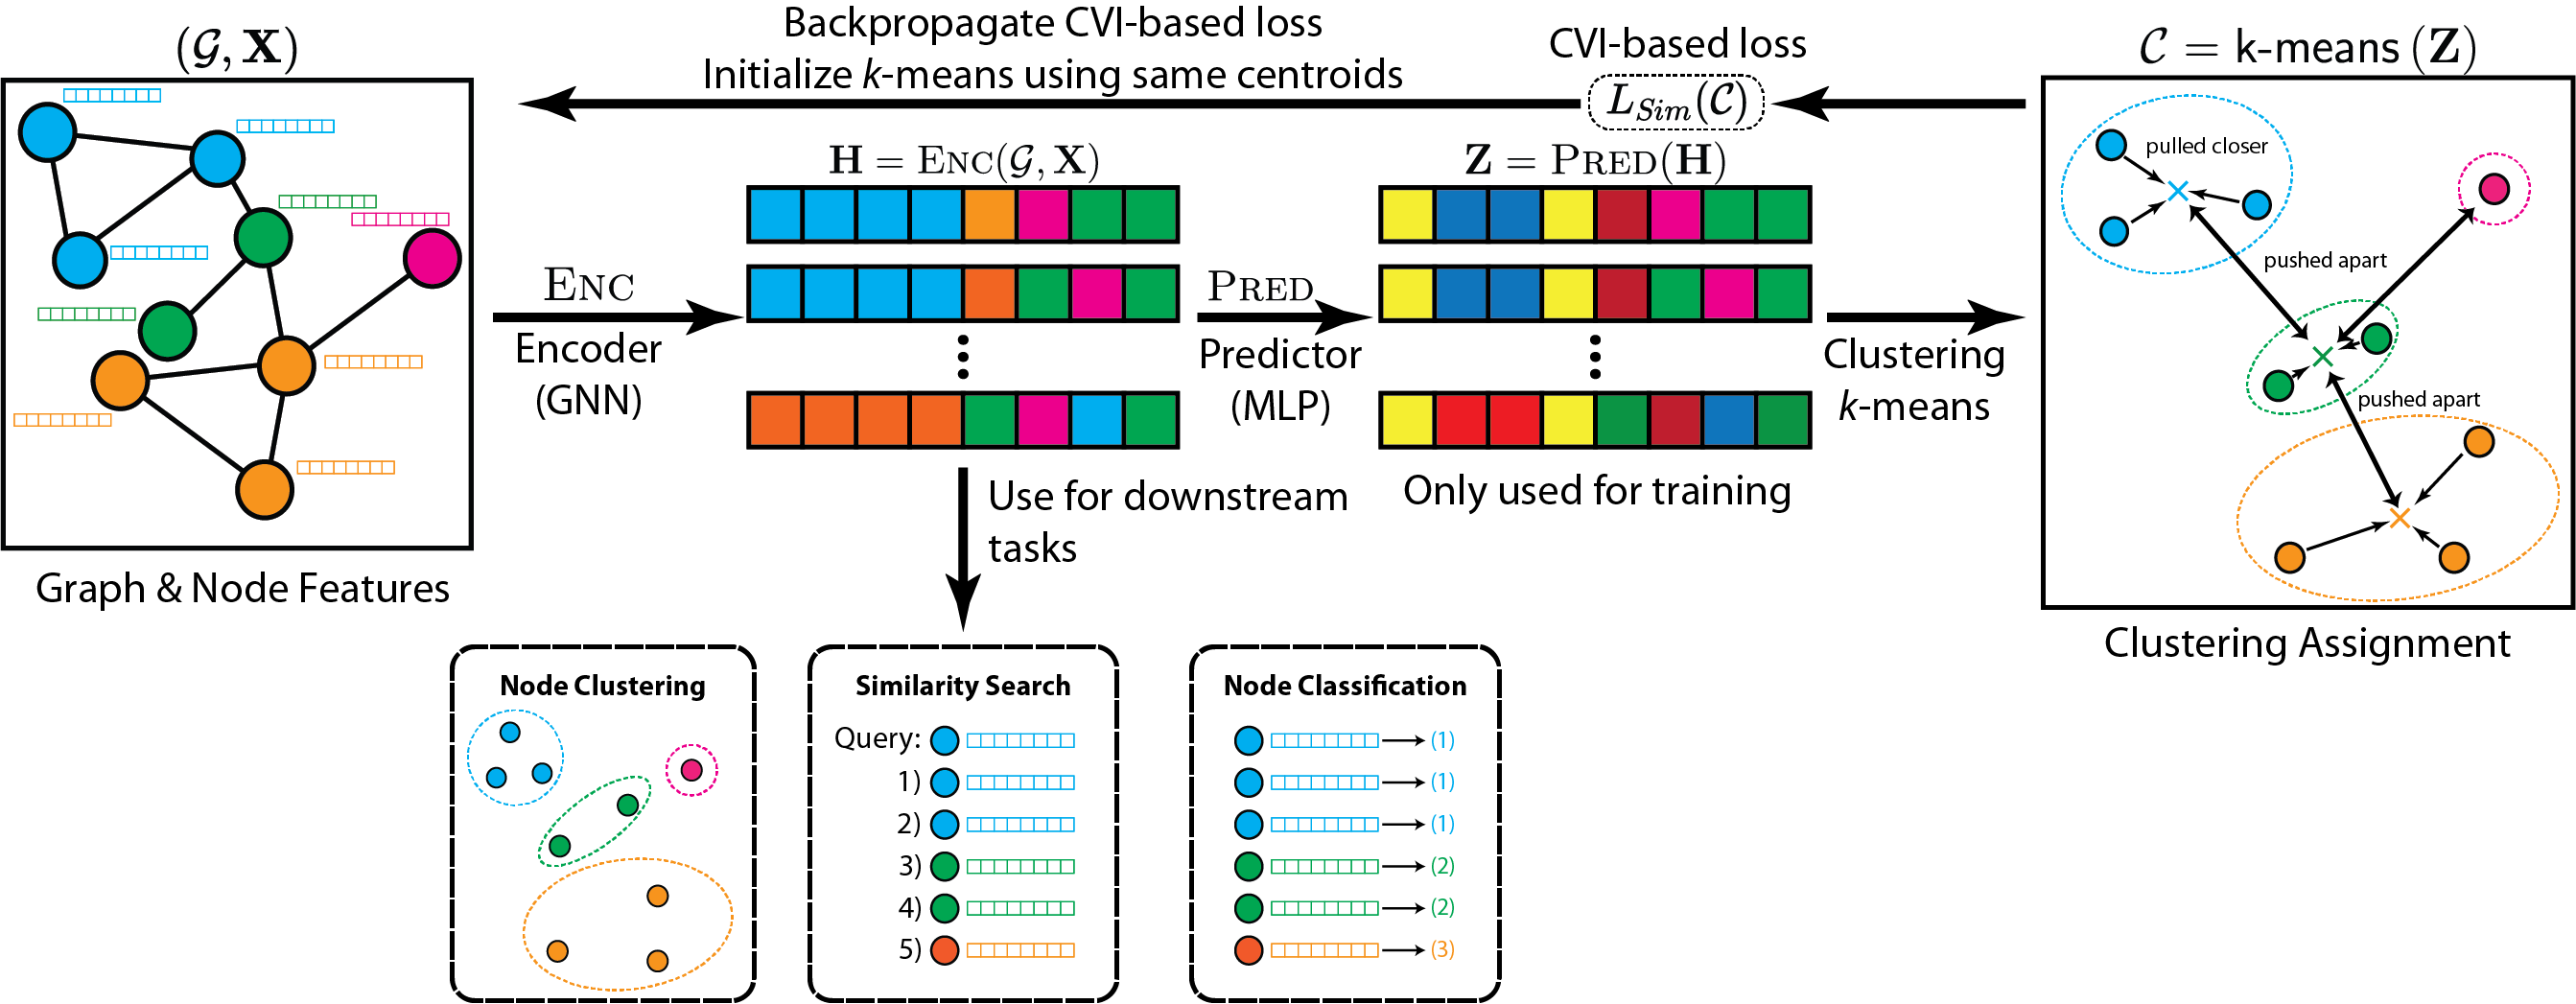
The input to CARL-G is a graph G with features for each node, represented by the feature matrix X. Our method aims to produce a set of embeddings H that can be used for various downstream tasks, like node clustering, similarity search, or node classification.
As shown above in Figure 1, CARL-G consists of four steps:
- Compute the embeddings H of the graph G using a GNN encoder.
- Compute the task-specific embeddings Z using an MLP encoder.
- Perform clustering (e.g., k-means) on Z to obtain a clustering C.
- Backpropagate using CVI-based loss (e.g., silhouette).
Once trained, we use H (the embeddings produced by the GNN encoder) for downstream tasks. It is worth noting that this framework works with different clustering methods and different CVIs. It is especially flexible as it allows for non-differentiable clustering methods (since no gradients flow through the clustering step).
This allows us to avoid many of the limitations of existing methods. For instance, many current state- of-the-art methods require careful generation of augmentations (systematic and careful perturbations of data points that increase the diversity of training samples) and/or complex architectures consisting of multiple networks that have shared or exponentially averaged weights. Our method avoids these limitations with a simple architecture and without augmentations. Depending on the choice of CVI (e.g., the simplified silhouette), we may also reduce the cost of obtaining contrastive samples (compared to typical contrastive negative sampling) by working directly with cluster centroids instead of individual points.
Results
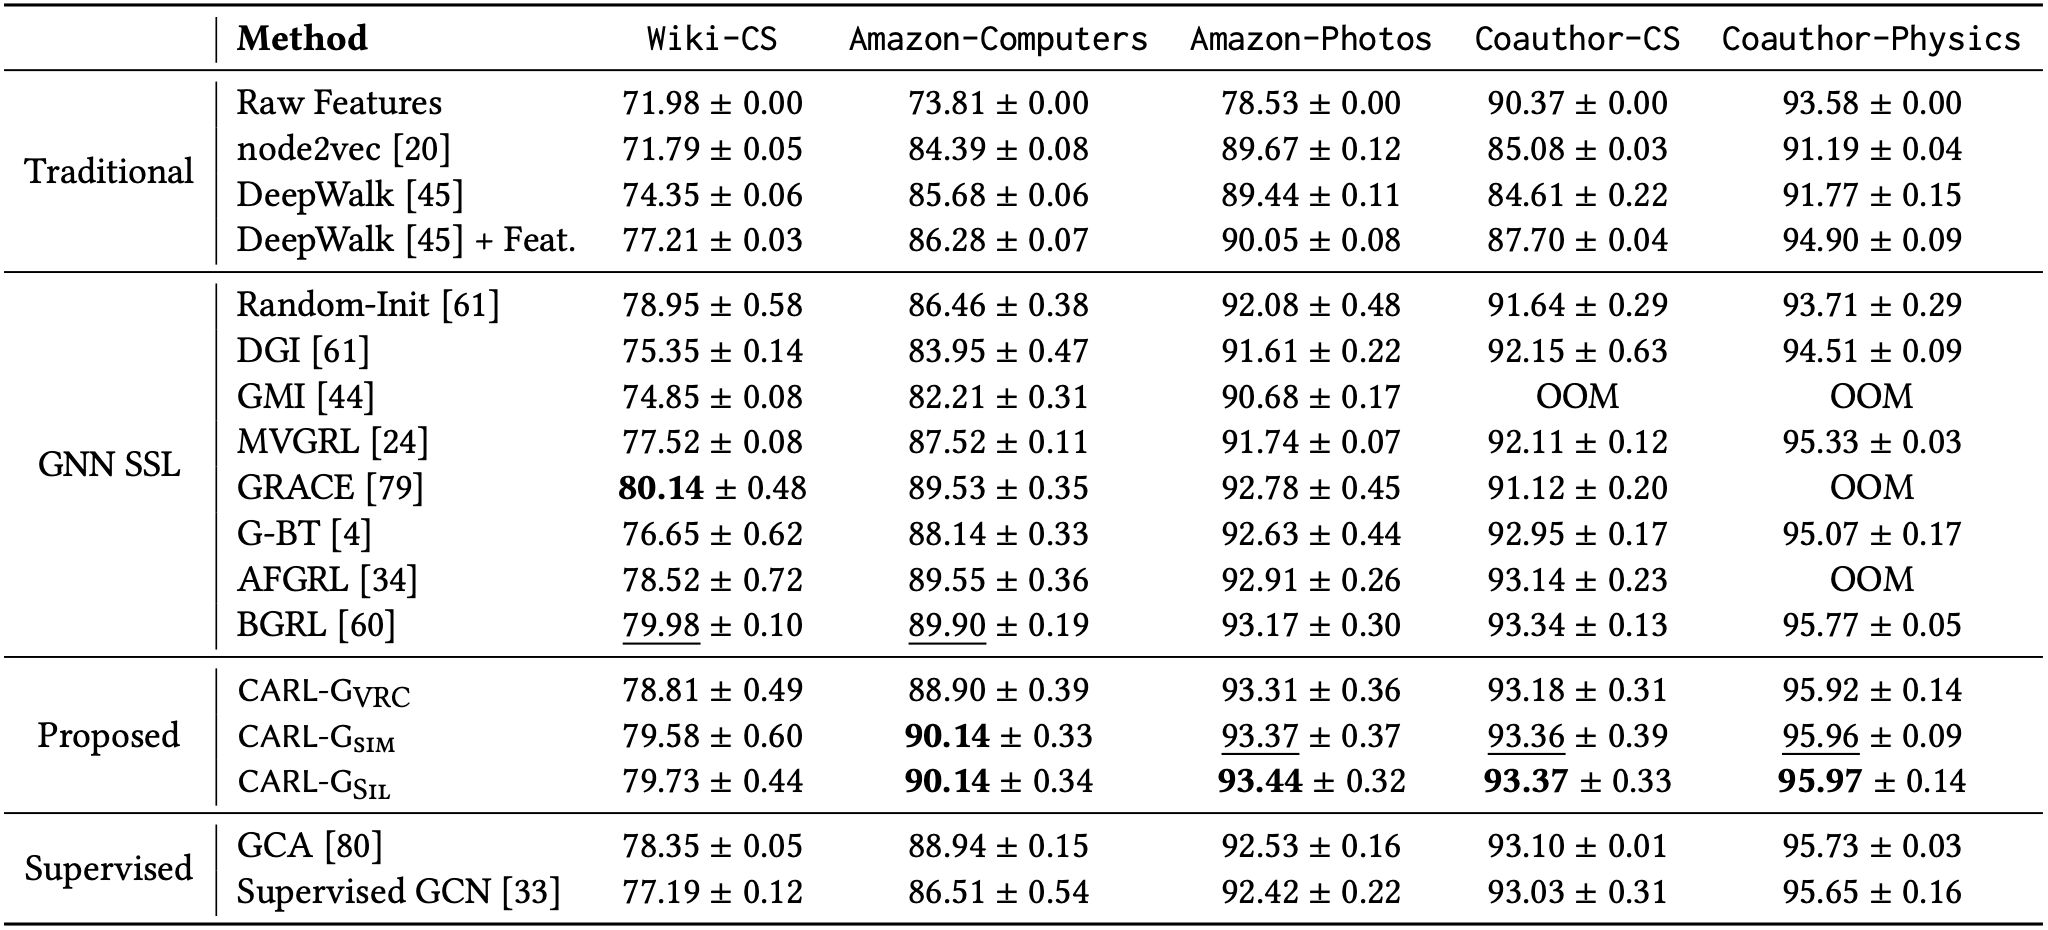
Following existing work in the area, we evaluate CARL-G on three tasks: node classification, node clustering, and node similarity search. CARL-G outperforms the baselines on 4/5 datasets in node classification and is comparable with AF-GRL, the best-performing baseline in the node clustering and similarity search tasks. Below, in Figure 2, we show a table of CARL-G’s strong node classification performance relative to other methods.
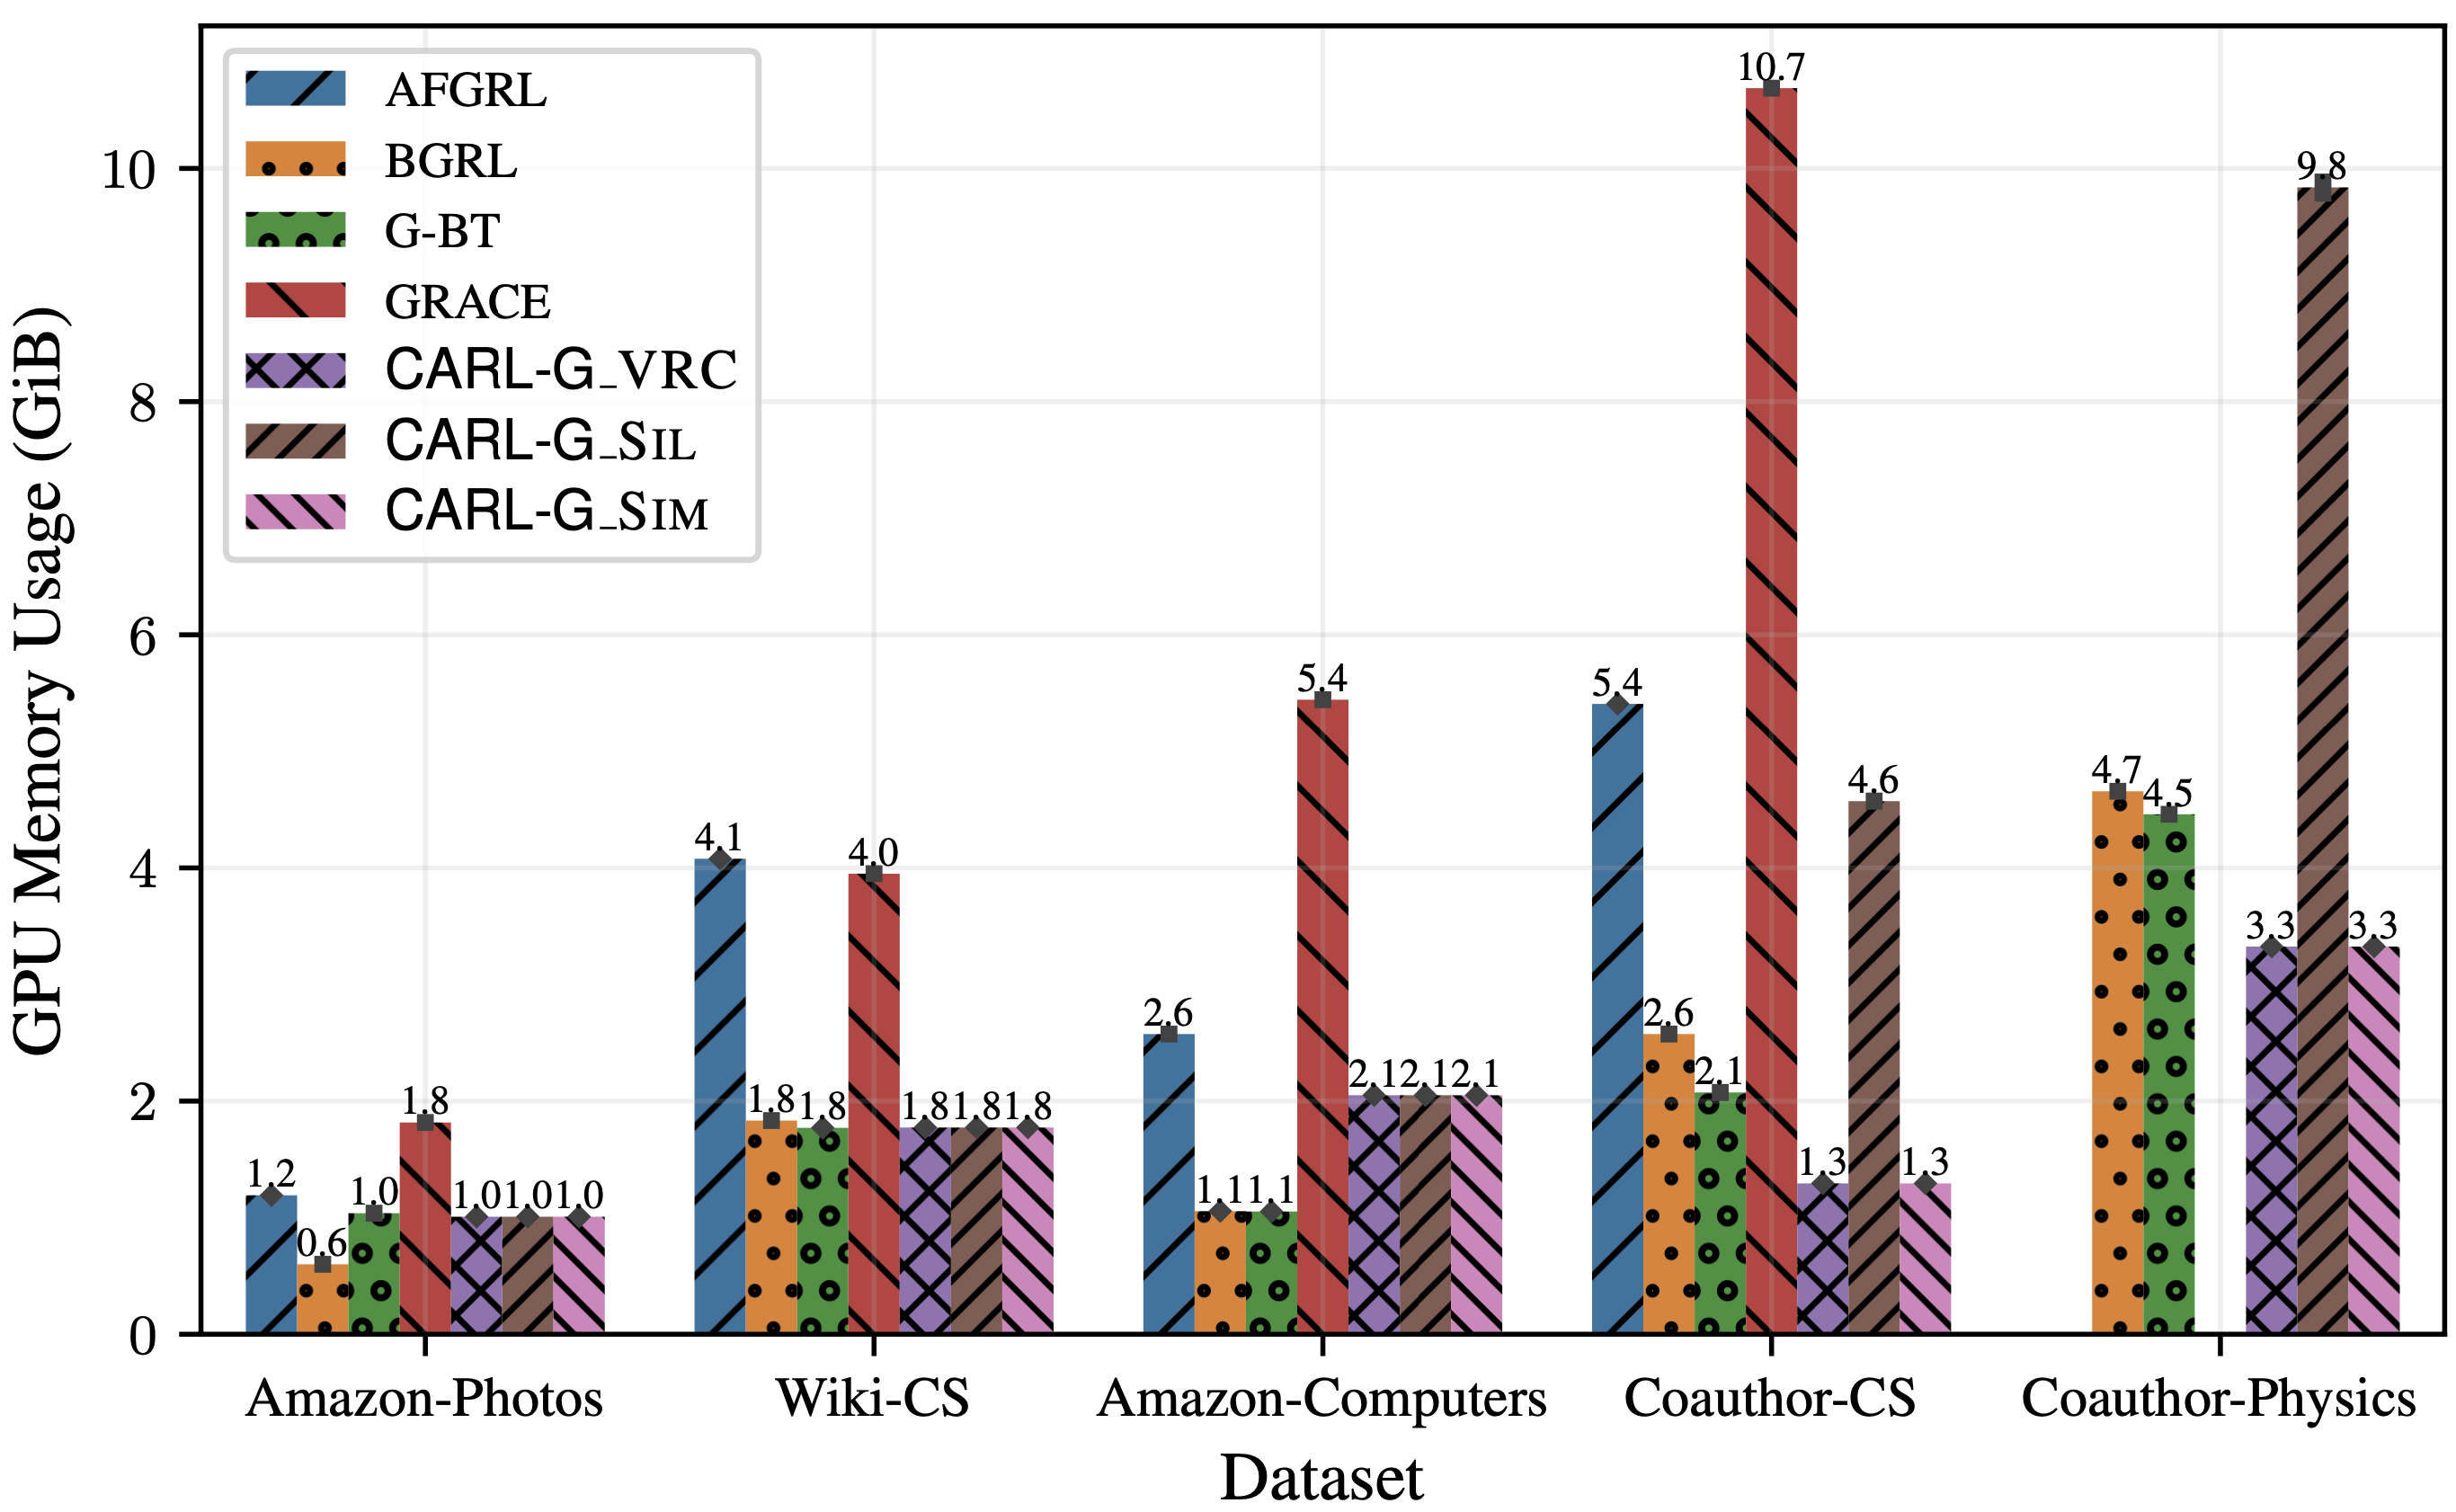
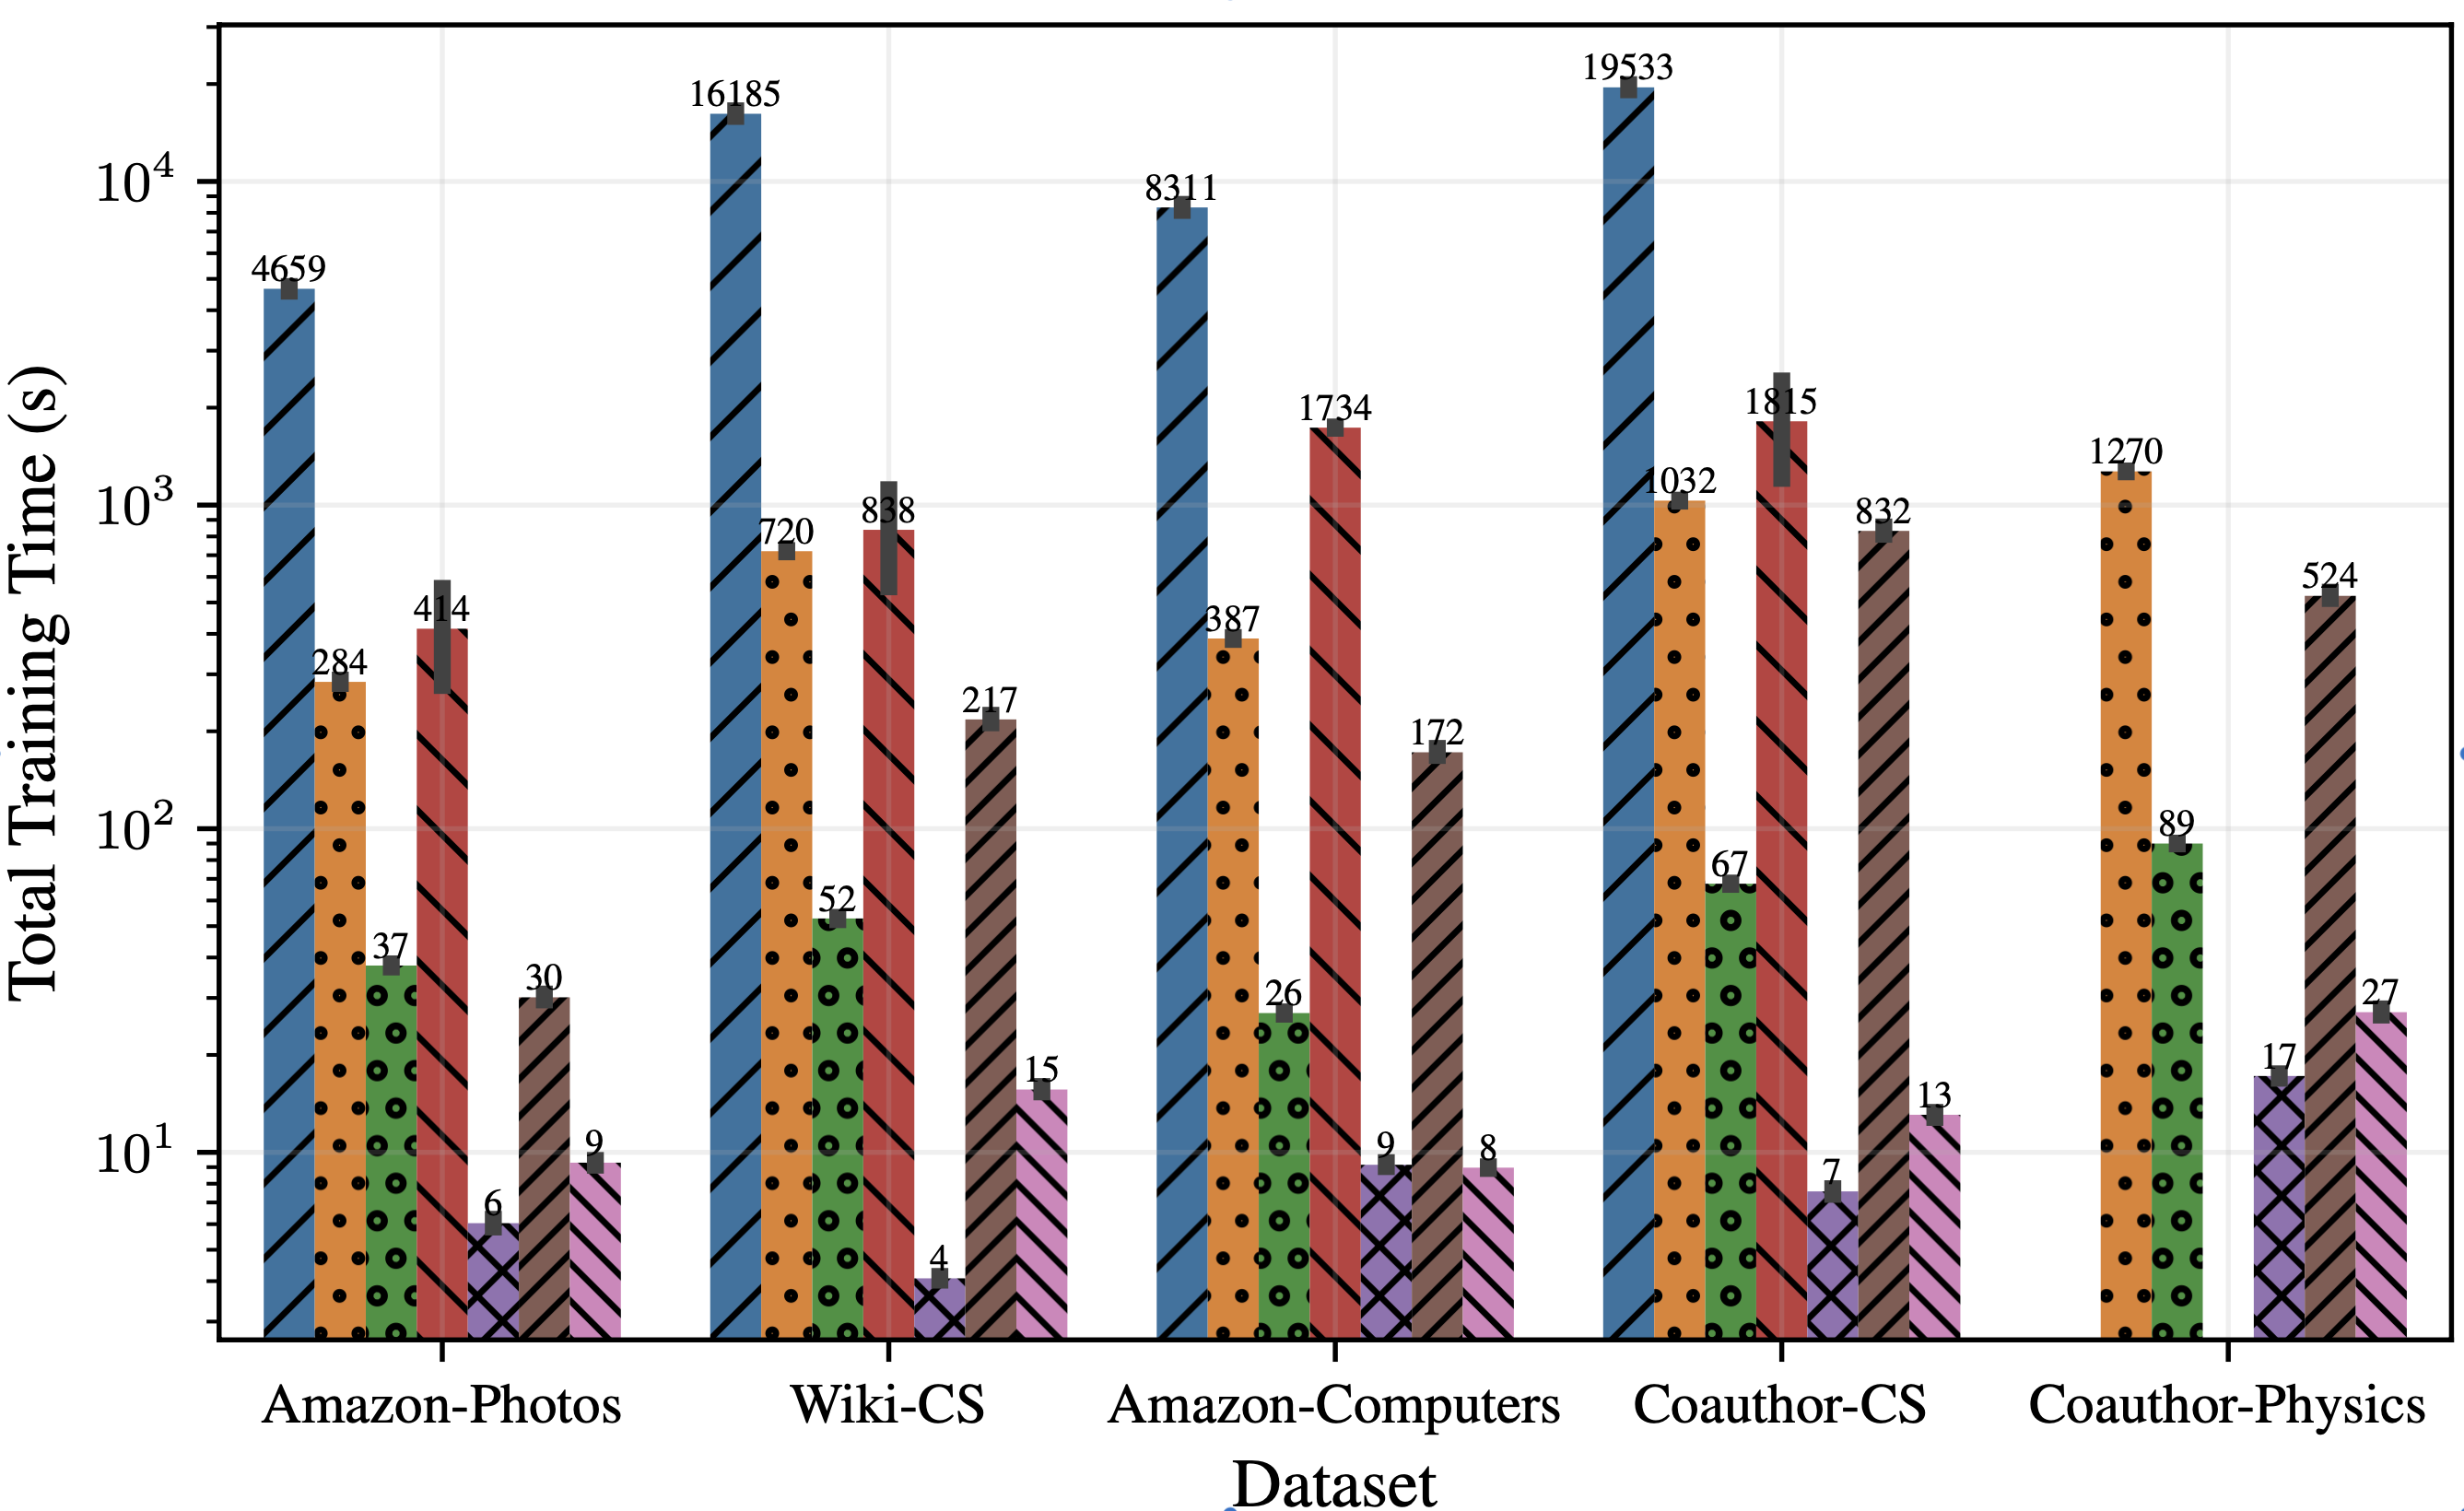
However, the key advantage of CARL-G lies in its large efficiency improvements over existing methods. In Figure 3, we show CARL-G’s training time and GPU memory usage compared to other baseline methods. We can see that CARL-G is much more efficient than the baselines when using VRC (Variance Ratio Criterion) or simplified silhouette. These experiments are conducted on standard graph benchmark datasets in the full-batch setting, and we plan to run experiments on larger-scale datasets in the future. Please refer to our paper for more details.
Conclusion
SSL on graphs is still a nascent area, with many lines of exploration probing the best ways to learn general-purpose representations for downstream graph tasks. We present a new line of work demonstrating the value of using clustering and CVI-inspired loss functions to learn node representations. In particular, our proposed method, CARL-G, showcases an exciting advance toward accelerating and improving self-supervised graph representation learning. It is much faster (up to 1,500x) while comparably accurate. Additionally, our work inspires several future lines of work: Are there CVIs or clustering methods which lead to better downstream representations? How does CARL-G fare on very large graphs in minibatch settings? We hope to explore these questions in the future. In the meantime, please check out our paper, code, or poster in person at KDD!